僕が実践しているWRITING TASK 1の勉強方法や注意点/スコアアップ術などをまとめてみました。
- 1、文字数
- 2、タイムマネージメントをしよう
- 3、比較・分析をしよう
- 4,エッセイの書き方
- 5,受動態の動詞を用いる
常時アップデートしてます。
ライティングはアイエルツのなかで一番難しいタスクの一つと言われます。
TASK 1 は図やグラフ、地図などの説明をすることになります。
意見を書くのではなく、自分がどれだけ分析して正しく情報を読み取れるかです。
どういう風に採点されているかは公式サイトでご確認くださいhttps://ieltsjp.com/japan/about/about-ielts/ielts-band-scores
僕が普段使っているアイエルツの英単語帳です。
4600単語が記載されていて、類義語や単語それぞれに例文がついているので、単語の使い方も分かりますので、アイエルツを勉強する上では必需品だと思っています。
それでは一つずつ見ていきましょう。
1、文字数

文字数は試験の中でも重要なポイントになります。
これから3つのポイントをご紹介していきます。
- 最低単語数
- おすすめ文字数
- 最高文字数
それでは簡単に説明していこうと思います。
①最低単語数
スコアを得るには最低文字数があります。
それが150字以上になります。
これを下回るとTask achievement の部分で減点になってしまいますので、20分間で書けるように練習しましょう。
②おすすめ文字数
僕は個人のおすすめは170-180字くらいがベストだと思ってます。
なぜなら、多すぎず最低単語数を十分に超えているので時間的にも最適かと思います。
また、修整したいときに最低文字数を気にしないで修整できるところです。
③最高文字数
最高文字数には制限はありませんが200文字以内にしましょう。
なぜなら、時間がありますし、メインポイントだけを書くのがベストです。
すべてを1から書いていては情報を読み取るというより、ただ見たものを書いていているだけになってしまいますのでメインポイントだけを読み取り、なるべく170 文字くらいを目指しましょう。
*(Computer delivered test では文字数が見えるので打ちながら確認できますので文字数を数える時間が短縮できるので便利です)
2、タイムマネージメントをしよう
アイエルツもライティングは時間があまりありませんので、しっかりと計画を立てる必要があります。
これから3つご紹介していきたと思います。
- TASK 2までの時間を残すように計算する
- 20分を目安にしましょう
- プランを立てる
それでは簡単に説明していこうと思います。
①TASK 2までの時間を残すように計算する
まず、考えなくてはならないのは1時間しかないですし、Task 2もあるということです。
Task1に固執して多く時間を費やしてしまうと、Task2に使う時間がなくなってしまいます。
ライティングはTask2の配点の方が高いので、
Task1に4割 (20分)
Task2に6割 (40分)
くらいの時間を使いましょう。
②20分を目安にしましょう。
上で話したように4:6の割合で時間を割くことができるとバランスよく時間を使えるようになりましょう。
Task1を書き終えるには20分以内で終えるよう心がけるよと良いでしょう。
例えば、普段から150字を20分以内で書き終われるように練習してみましょう。
このときは内容よりも20分以内で150字書き終えることに注意して練習すると良いと思います。
最低文字数が150字ですので、これはマストです。
20分以内で150字以上書けるようになってから、自分で書いた文を読み直して内容や自分のミスなどを探すようにしましょう。
まずは20分で150字です。
それを達成するにはプランを最初に立てることが個人的には良いと思います。
③プランを立てる
Task1のライティングを始める前に自分なりのプランを立てると、時間の使い方が上手になってきます。
例として、僕の場合はこういうプランを立てます。
質問文の理解
図の分析・比較
ライティングの構成内容の作業
(トピック、図からの比較•分析、結論)
1~2分
Task1 ライティング作業
18~9分
(プラン例)
僕の書き方:
1,トピックセンテンス (題名を同じような意味の単語を使って表したもの)
2, 結論、結果、オーバーオール
3,図の分析結果や比較
のように書きます。
2の結論は必ずしも最後に書く必要はありません。
むしろトピックセンテンスの後ろに書いておいた方が、時間がなくなったときに結論を書き忘れることがないので得策です。
また、あとで触れますのでザッとで大丈夫です。
(トピックセンテンス)
The maps describe information about the town of Langley in the period of 1910 and 1950.
(結果)
Overall, Langley in 1910, it mainly had a lot of houses all over the place and more workplaces such as a factory.
In contrast, there were more mansions and flats on bothJordan street and Sherman street as well as a park and more shops instead of a factory in 1950.
(図の比較、分析結果)
Firstly, In 1910, there were a lot of townhouses on Jordan Street and Sherman Street. It had only few shops such as a store, a Laundry and a Café on Sherman Street. There was a rail way nearby railway worker’s cottages. In addition, a Factory was built in wasteland
outside of Sherman Street behind
shops and houses
On the other hand, in 1950, it got a big park called Sherman park with area of Children’s play. in the middle of the town. The town had more
mansions instead of
townhouses compared to 1910. Also, there were more stores instead of the factory in 1910. The railway did not exist in the town in 1950.
183words
計20分 くらいが理想だと思います。
可能なら読み直しもできたら最高ですが、時間的には厳しいのでミスしないように意識しながらも取り組みましょう。
3、比較・分析をしよう

Task1の出題図はいろいろなものがあります。
あとでも紹介しますが、棒グラフ、円グラフ、地図、テーブル図、ライングラフやダイアグラムなどさまさまな種類があり、試験では1つもしくは同じグラフが2つ、または、2種類の図が出題されることがありますので、すべての出題形式に慣れておくと良いでしょう。
僕が自作した図をいろいろな図を紹介します。
- Bar chart
- Table chart
- Line graph
- Diagram
- Pie chart
それでは簡単に説明していこうと思います。
次の図を自分なりに分析し、まず特徴を探すところから始めましょう。
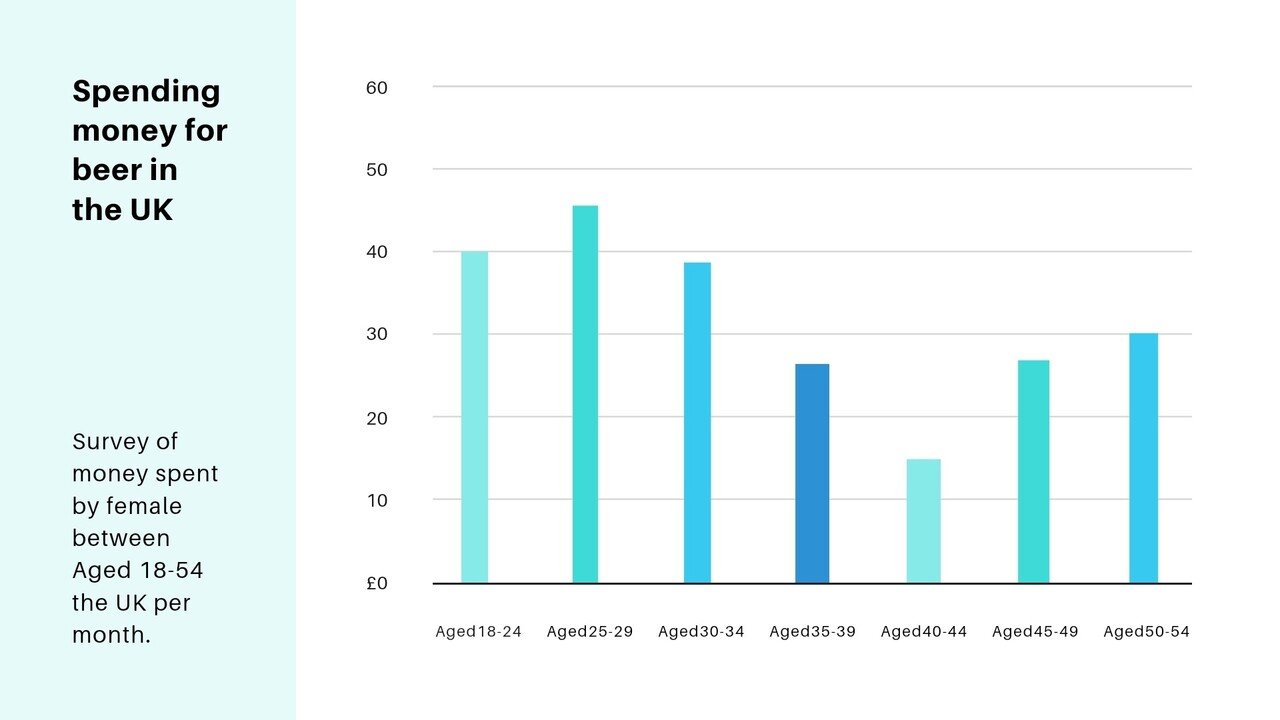
Bar chart
Bar chart = 各カテゴリー1番数値が高いところと低いところを探す。
2種類のグラフを比較する場合は、相違箇所を見つける。
差が大きい場所や差が近い部分を見つける。
Chart 1
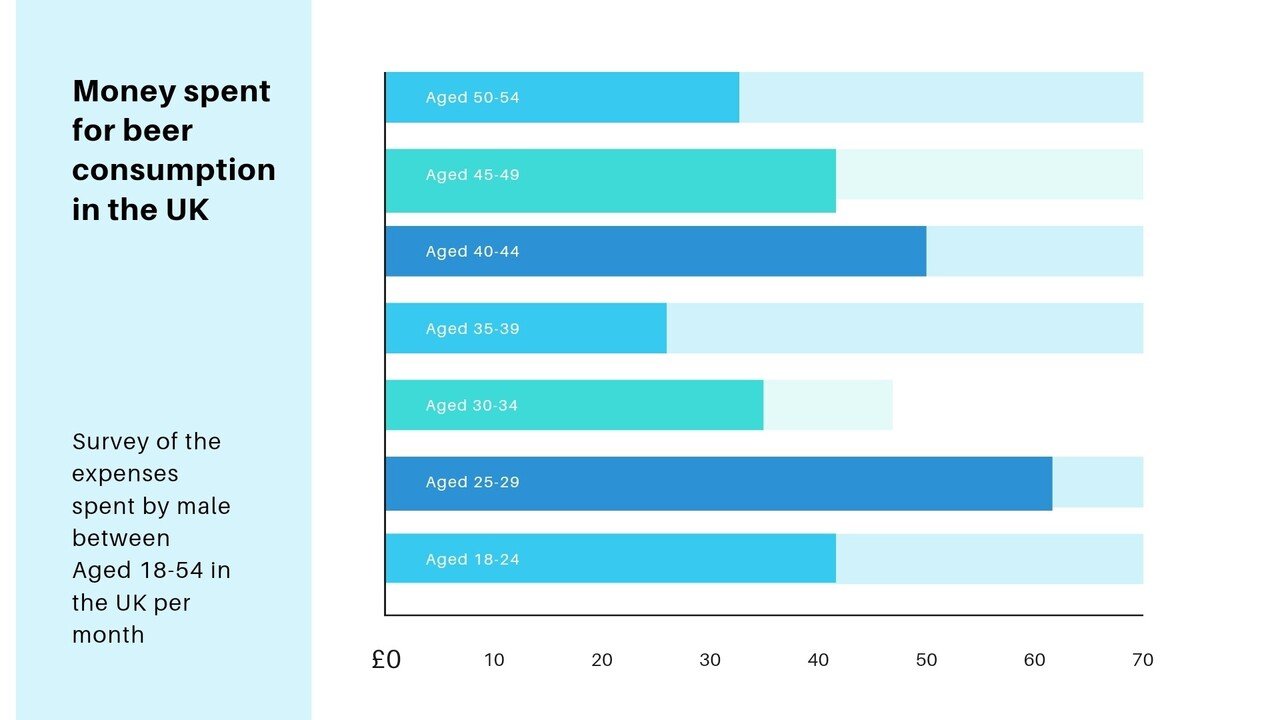
Chart2
Example 1
Those illustrations show the average of money spent for consuming beer by British people both male and female aged from 18-54 in the UK within a month. (26 words)
Overall, both male and female aged 25-29 use more money than rest of people in a month. However, male aged 35-39 spend minimum money and female aged 40-44 use the least money for beer. (34 words)
To begin, British male seem to spend more money on alcohol than girls who spend for beer. guys between the age 25-29 have more consumption than others, which is about £60 spent for beer. This is the most in male. surprisingly, the second most money spent by is the aged 40-44 with £50. However, guys age 35-39 do not drink beer at all. that doesn’t even reach at £30, which is the lowest number. (74 words)
On the other hand, . Although young girls who are between 25-29 want to drink more beer than others, that is about £45. However, more girls have less beer consumption to aged 40-44 with only about £ 15 in a month. Interestingly, when girls are 45-49 and 50-54, they have more beer reaching at £25 and £30 respectively.
(56 words)
Total 190words
*Useful vocabularies
1, in comparison, compared to, compared with
2, ↗ = more than, larger, over, higher,
3, ↘ = lower than, under, smaller,
4, similar, almost, a little,
5, The highest/largest number/percentage /proportion is
6, The lowest/smallest number/percentage /proportion is
7, also, and, In addition, furthermore, moreover, too, besides, as well as
8, However, Although, Even though, Though, But, While, On the other hand
9, Overall, Generally
10, In conclusion, To conclude, To sum up
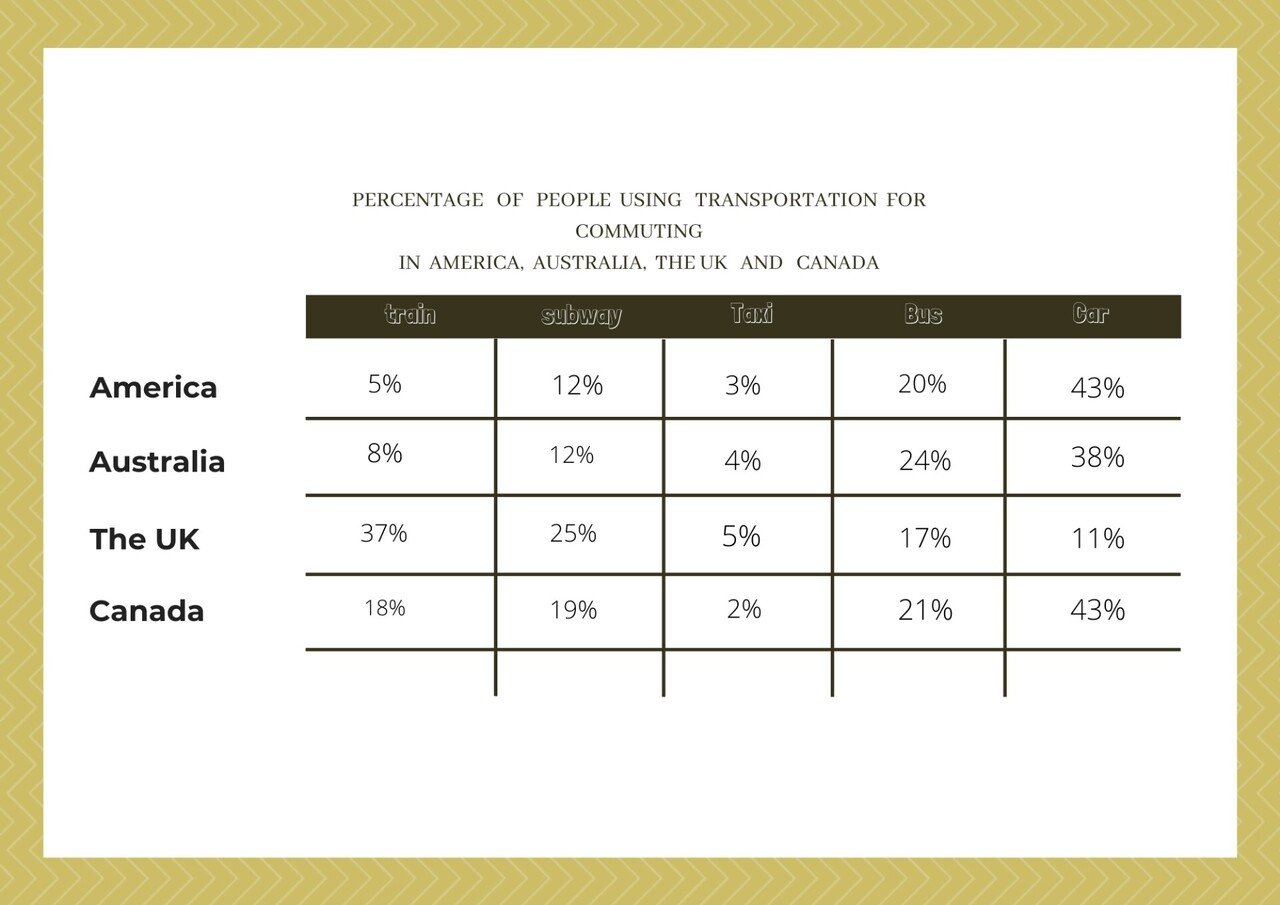
Table chart
Table chart = 分析して数字の高いところと低いところを探し出し、各カテゴリーごとに高いところと低いところ比較・分析。
Map
2種類の図が使われている場合、1つの全体的な地図の説明、2つ目は1つ目との相違などの大きく変更されてる部分を比較・分析などの重要部分を説明。
また、質問文に提案などがあればどこが良いか探し理由をつける。
*Useful vocabularies
1, in comparison, compared to, compared with
2, ↗ = more than, larger, over, higher,
3, ↘ = lower than, under, smaller,
4, similar, almost, a little,
5, The highest / largest number / percentage / proportion is
6, The lowest / smallest number / percentage / proportion is
7, also, and, In addition, furthermore, moreover, too, besides, as well as
8, However, Although, Even though, Though, But, While, On the other hand
9, Overall, Generally
10, In conclusion, To conclude, To sum up
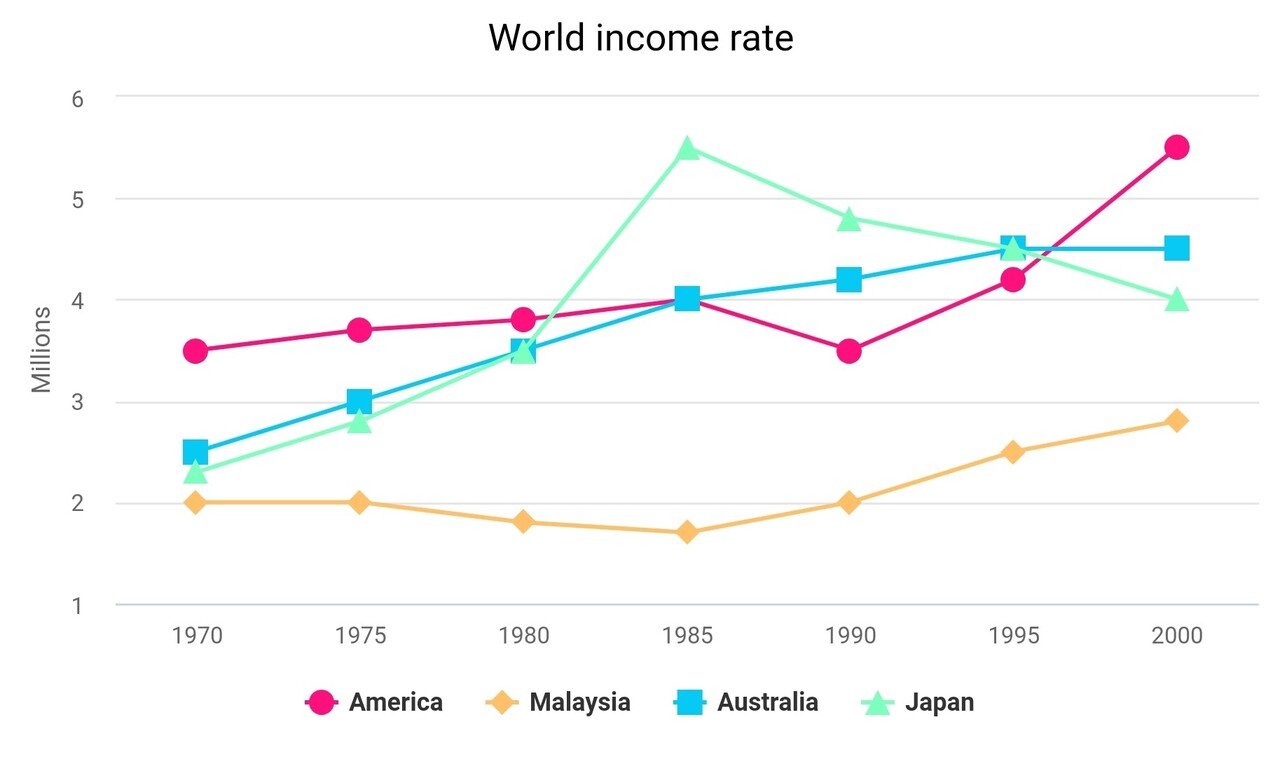
Line graph
Line graph = 同じく各カテゴリーの数値の高い場所、低い場所を見つけ、比較・分析をする。 その後の推移なども書ければ良い。
*Useful vocabularies
1,↗ (V)= goes up, increase, skyrocket, grow, rise up, reach a peak
2,↘ (V)= goes down, decrease, decline, fall down, plummet, plunge, drop
3,→ (V) = level out, remained stable, remained unstable, remained steady
4,↗(N) = increase in, recovery
5,↘(N) =decrease in, fall in
6, slightly, gradually, steadily, rapidly,
7,slight, steady, rapid,
8,↗ = more than, larger, over, higher,
9,↘ = lower than, under, smaller,
10, similar, almost,
11, The highest/largest number/percentage /proportion is
12, The lowest/smallest number/percentage /proportion is
13, The number of something, The amount of something, The percentage of something ,
The proportion of something
14, firstly, secondly, after that, before, then, next, eventually, finally 、repeatedly,
15, However, Although, Even though, Though, But, While, On the other hand
16, also, and, In addition, furthermore, moreover, too, besides, as well as
17, Overall, Generally
18, In conclusion, To conclude, To sum up
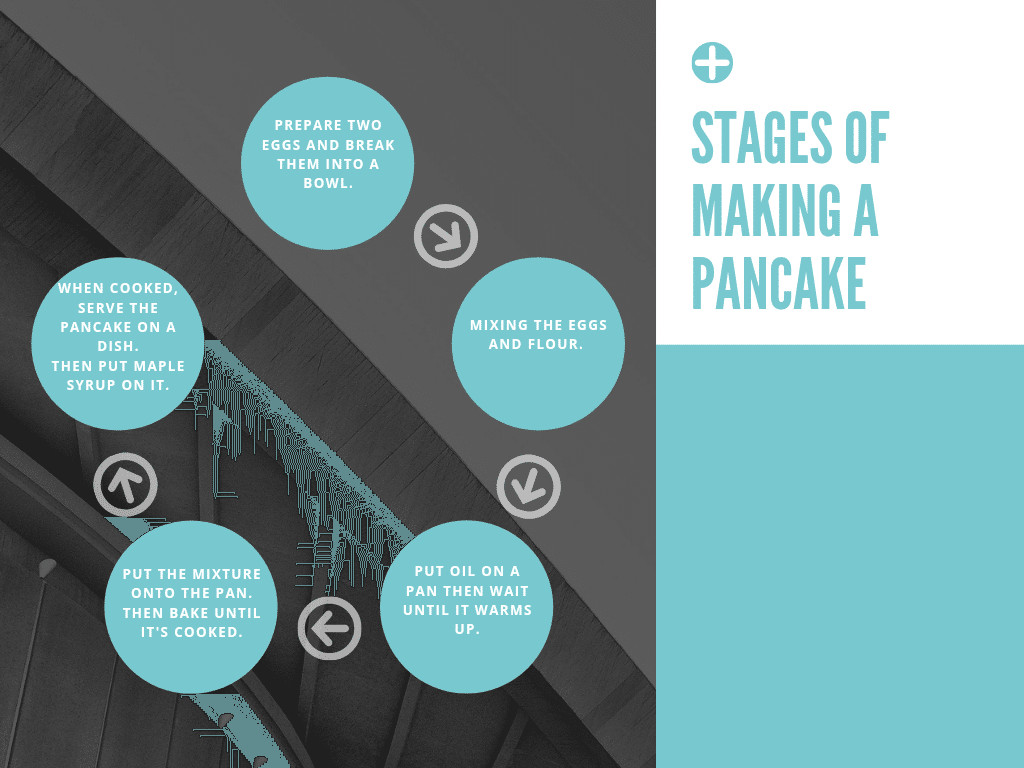
Diagram
Diagram = ある一つの物の製造工程作業やサイクルなどの説明になります。こちらは比較・分析というよりは、いかに一つずつの工程をしっかりとparaphraseしながら説明できるかがキーになります。
*Useful vocabularies
1, firstly, secondly, after that, before, then, next, eventually, finally 、repeatedly,
2, It consists of~,
3, It is passed through, They are delivered to, It is pressed, It is put, It is heatedなどの受動態を使うと効果的。
4, However, Although, Even though, Though, But, While, On the other hand
5, Overall, Generally
6, In conclusion, To conclude, To sum up
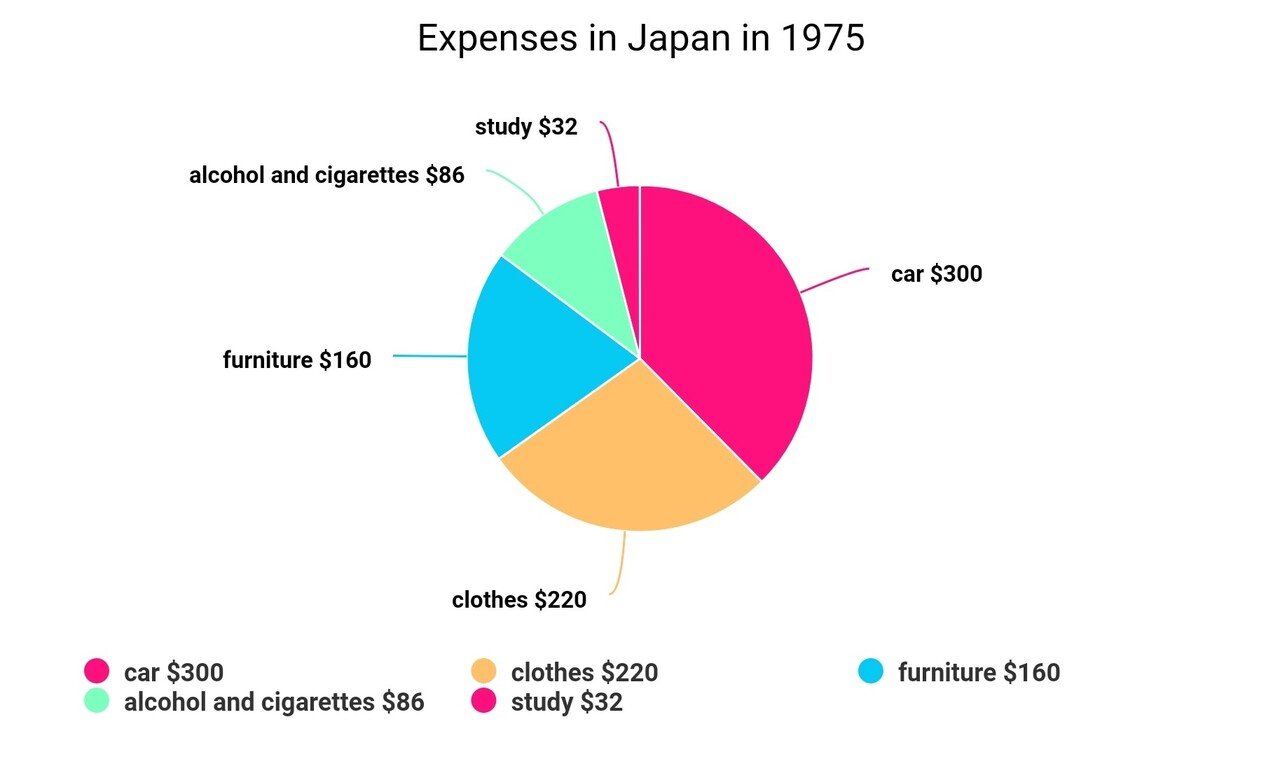
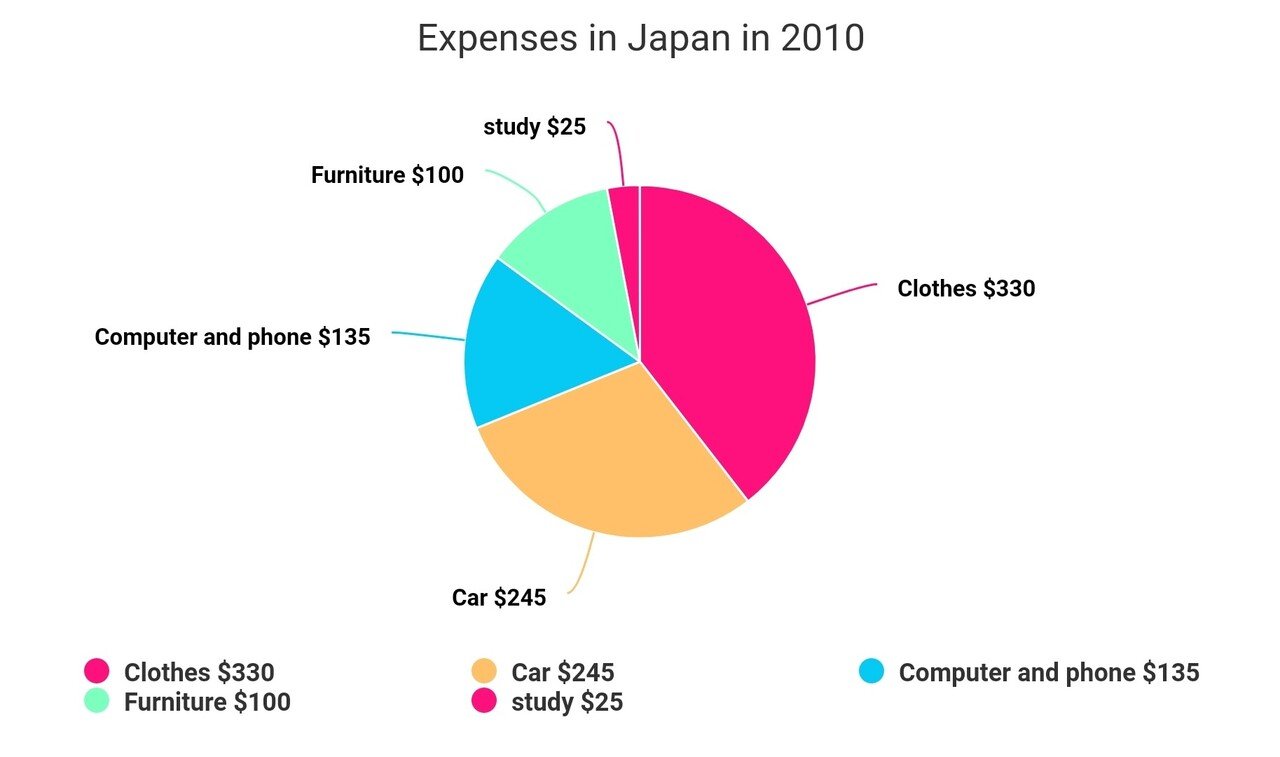
Pie chart
Pie chart = 各カテゴリー1番数値が高いところと低いところを探す。2種類のグラフを比較する場合は、相違箇所を見つける。 差が大きい場所や差が近い部分を見つける。
*Useful vocabularies
1, in comparison, compared to, compared with
2, The number of something, The amount of something, The percentage of something , The proportion of something
3,↗ = more than, larger, over, higher,
4,↘ = lower than, under, smaller,
5, similar, almost, a little,
6, The highest/largest number/percentage /proportion is
7, The lowest/smallest number/percentage /proportion is
8, also, and, In addition, furthermore, moreover, too, besides, as well as
9, However, Although, Even though, Though, But, While, On the other hand
10, Overall, Generally
11, In conclusion, To conclude, To sum up
4,エッセイの書き方
ここからはエッセイの書き方をご紹介します。
この下の文は以前僕が練習として書いたものです。
この文の長さで183単語になります。
基本的に4つほどのに分かれたエッセイを書くのがベストです。
(Example 1)
The maps describe information about the town of Langley in the period of 1910 and 1950.
Overall, Langley in 1910, it mainly had a lot of houses all over the place and more workplaces such as a factory. In contrast, there were more mansions and flats on both Jordan street and Sherman street as well as a park and more shops instead of a factory in 1950.
Firstly, In 1910, there were a lot of townhouses on Jordan Street and Sherman Street. It had only few shops such as a store, a Laundry and a Café on Sherman Street. There was a rail way nearby railway worker’s cottages. In addition, a Factory was built in wasteland outside of Sherman Street behind shops and houses.
On the other hand, in 1950, it got a big park called Sherman park with area of Children’s play. in the middle of the town. The town had more mansions instead of townhouses compared to 1910. Also, there were more stores instead of the factory in 1910. The railway did not exist in the town in 1950.
① 質問文のParaphraseした文を書く。
すべてを違う単語で書く必要はないです。
mapはmapです。
graphにはなりません。
オススメは同じ単語を違うフォームにすることです。
improve → improvement これにより動詞が名詞になるので同じ意味でも違う単語に置き換わります。
また、同じ意味でも違う文章で書くことも出来ますので基礎文法はしっかり理解する必要があります。
The maps describe information about the town of Langley in the period of 1910 and 1950.
② メインポイントの情報を読み取り、結論として書く。
まず、図などを見たときにメインポイントや大きな相違点などを探して結論として書きます。
そうすることによって、自分の書くべきポイントが見えます。
最後に結論を書いてもいいですが、時間がなくなったりして書き忘れたら、減点につながります。
Overall, Langley in 1910, it mainly had a lot of houses all over the place and more workplaces such as a factory. In contrast, there were more mansions and flats on both Jordan street and Sherman street as well as a park and more shops instead of a factory in 1950.
③ ②番で見つけた部分について詳しく記載していく。
②番で見つけたメインポイントについて数値や情報載せて比較・分析していく。
また、期間などをを含む場合もその期間にどういう変化しているのかを分析して明確に書いていくといいでしょう。
図が2つある場合は一つずつ分析していき、それぞれ違うparagraphに書くといいでしょう。
両方を比較した結論を②番のなかに書きます。
Firstly, In 1910, there were a lot of townhouses on Jordan Street and Sherman Street. It had only few shops such as a store, a Laundry and a Café on Sherman Street. There was a rail way nearby railway worker’s cottages. In addition, a Factory was built in wasteland outside of Sherman Street behind shops and houses.
On the other hand, in 1950, it got a big park called Sherman park with area of Children’s play in the middle of the town. The town had more mansions instead of townhouses compared to 1910. Also, there were more stores instead of the factory in 1910. The railway did not exist in the town in 1950.
(Example 2)
The graph illustrates the number of the birth and death rates in New Zealand from 1901 to 2101.
Overall, it can be seen that there was a rapid increase. Then, it slightly decreased in the rate of birth. Whilst the death rate continued to rise up then remained steady.
To begin with birth rate, the figures started only 20000 in 1901. The figures continued to fluctuate till 1941. It suddenly skyrocketed to approximately 65000 from below 30000 within 20 years in 1961. However, it was the peak. Then, it started to drop gradually to just over 40000 in 2101.
While, the rate of death was just below 10000 in 1901, which was the least number in the period. However, the figures started to increase slightly although there was a fluctuation for long time for about 100 years. It dramatically kept rising up from below 30000 in 2001 to just below 60000 in 2041, which reached the peak. It overtook the birth rate as well. After that, it levelled out the same level till 2101.
上の太文字になっているような単語を使うとスコアアップにつながります。
このような単語を正しく使っていくことでBand 6に近づくことができます。
使い慣れていない単語もたくさんあると思いますが、練習で何回も書いて自分の物にしてほしいと思います。
5,受け身の動詞を使う(受動態)
-1024x576.jpg)
Task 1 及び Task 2は受動態の文を用いることで文法の部分での加点ができます。 とくにTask1では受動態を使うことでより簡単に説明ができるようになります。
例えば、
It was built = It built,
is passed = It passes,
are delivered = They deliver,
It is pressed = It presses,
This is put = This puts ,
It is heated = It heats
などの受動態を使うことによって幅広い表現が使えるようになります
まとめ
今回はTask 1のスコアアップの5つ勉強法をご紹介してきました。
1、文字数
2、タイムマネージメントをしよう
3、比較・分析をしよう
4,エッセイの書き方
5,受動態の動詞を用いる
試験では、基礎英語と単語力が非常に重要になります。
ぜひ、テクニックだけではなく英語の基礎力をあげる努力をすると必然的にスコアもアップすると思います。

コメント